
Day 20
Debugging Your Applications
It seems like only yesterday that I was using Expediter to test my big-iron application on an IBM 3090. Actually, it was 8 years ago, and I have tried to forget that I ever developed character-based applications for the mainframe. The positive aspects of mainframe development were the integrated and comprehensive tools that were available for testing your application. Then, the client-server wave hit, freeing everyone from the mainframe behemoth. With this wave, new possibilities were introduced, along with new challenges. Testing and debugging an application initially felt like you were undergoing a process of cupellation to reach your final destination of a thoroughly tested application. As client-server technology has matured, the testing tools that are available have also been refined.
Now, the Web-based applications are upon us, bringing with them their own set of challenges, and, as you would expect, the testing challenge has heightened in complexity. This dilemma is in large part due to the number of technologies that can be integrated to build your application for the Web. There aren't many integrated debuggers available that you can use to test your application. Also, many books are being written about building applications for the Web without giving much thought into the debugging and testing aspects of this process. Web-based development is at the point where client-server was when it first came out. I think you will see a heightened interest in this topic in the next couple of months and years.
Today's lesson provides some considerations concerning the testing and debugging of your application. While the lesson doesn't provide the silver bullet concerning this topic, you will receive many gems of knowledge that can be applied to your Web-based application development. The first part of the lesson focuses on the types of bugs that you can possibly encounter. It's always good to know your opponent before you choose your weapon. Next, the lesson explains and demonstrates how to debug your script both on the client and the server. You also learn how to implement error-handling routines in your code to capture and how to exterminate your bugs. Examples of how Visual InterDev traps and displays errors are given. The final lesson of the day covers common considerations about testing and debugging your application.
Types of Bugs...Not That Your Code Has Any!
This section explores the types of errors and bugs that you will uncover while developing a Web-based application with Visual InterDev. This isn't to imply that your code will have bugs; but, on that rare occasion that you encounter one, you will understand how to resolve it.
Because Visual InterDev supports the use of many different technologies, the possible types of errors grow exponentially with each new component that you add to your project. Fortunately, many of the advanced objects that you will use in your project can be debugged with their own debugger. For example, if you create and use an Active Server Component built with Visual Basic, you can use Visual Basic's powerful debugger to analyze problems with your component. In general, you will face the following types of bugs at some time in your Web-based application development career:
- HTML errors
- Component errors
- Database errors
- Script errors
The following sections explore each of these error categories.
HTML Errors
HTML serves as the foundation language for constructing pages on the Web. For this reason, you will implement a good amount of HTML within your Visual InterDev project, leaving room for errors. You can use the FrontPage Editor for Visual InterDev to reduce your chance for errors, but they will invariably show up at the worst time.
One type of HTML error you may encounter involves invalid hyperlinks. This error is sometimes the result of a URL address that has been deleted, causing your link to go into a black hole, as seen in Figure 20.1.
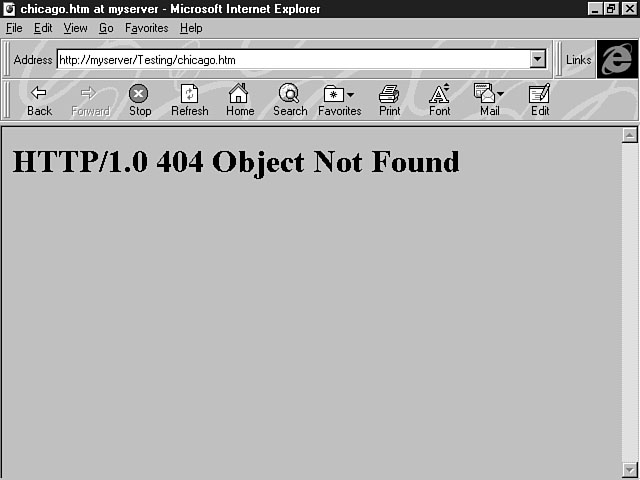
Where in the world has my page gone?
Another cause of a bad hyperlink involves a URL address whose content has changed. In this scenario, the user accesses the hyperlink expecting to go one page and ends up viewing another one. In Figure 20.2, the user has pressed a hyperlink to view a schedule of Houston Rockets basketball games, but instead travels to a schedule of the Chicago Bulls.
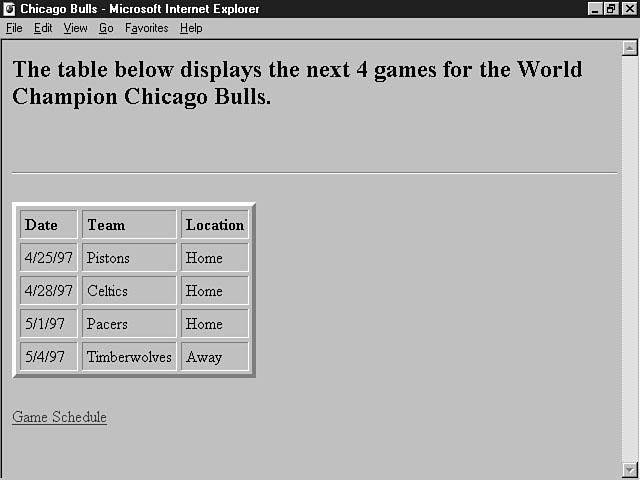
Traveling north instead of south.
You also may encounter errors that involve forms, tables, and overall document structure. For example, your code could contain unclosed tags that will cause an error in your code. Also, your HTML may be completely valid for some browsers, but not for others. A common error for pages that consist of tables involves unclosed <TD>, <TR>, and <TH> tags. If your table contains a lot of data, it's easy to leave off a closing tag, thereby creating an error in your HTML code. Other errors include spelling and grammatical mistakes in your web page. The written communication within your web page is vital to its acceptance. Users of your web site won't have a lot of confidence in the reliability of your application if the basic text that describes a web page isn't correct.
Resolving Conflicts in Your HTML
Now that you know some of the problems you face concerning HTML, the lesson outlines some tools that can help you analyze and resolve these errors. One resolution is a tool that's available as a service on the Web called Doctor HTML. This program is a web site analysis tool that provides a pretty comprehensive review and evaluation of the web pages contained in your site. You can find this product at the following location:
http://imagiware.com/RxHTML/
You provide a URL address for your web site and indicate the kinds of tests that you want the Doctor to perform, as shown in Figure 20.3.
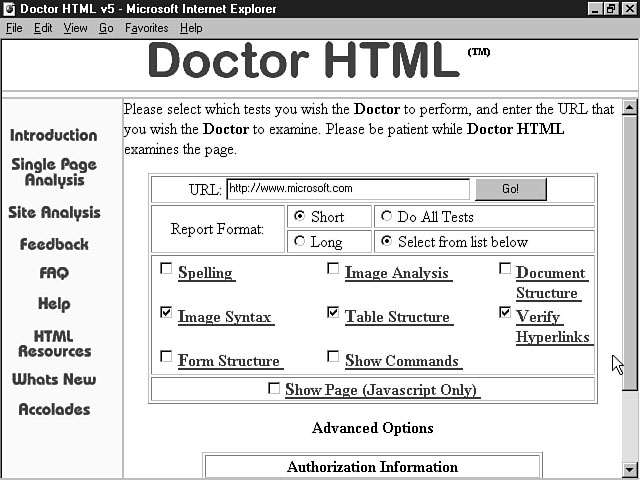
Getting an HTML checkup.
Doctor HTML provides an intuitive interface and is easy to use. As you can tell, Doctor HTML can perform several kinds of tests for your web pages, including image analysis and syntax checking, verifying the spelling, confirming the HTML syntax, analyzing document, table, and form structure, and validating hyperlinks. After the Doctor performs the check-up, you will receive a report similar to the one displayed in Figure 20.4.
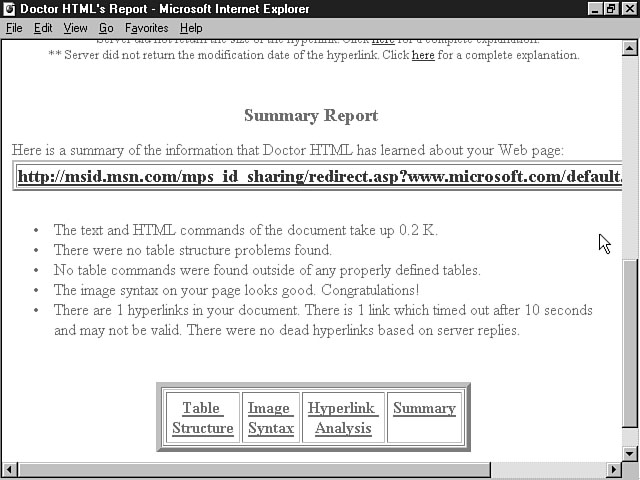
Receiving the news.
Doctor HTML is a good tool for debugging your HTML in several ways. The report that is returned is comprehensive yet easy to understand. Table 20.1 outlines several other tools that are available to validate your HTML.
Table 20.1. HTML validation tools.
| Tool | Location |
| Arena Browser | http://www.yggdrasil.com/Products/Arena/ |
| htmlchek | http://uts.cc.utexas.edu/~churchh/htmlchek.html |
| MOMspider | http://www.ics.uci.edu/pub/Websoft/MOMspider/ |
| WebTechs Validation | http://www.webtechs.com/html-val-svc/ |
| WWWeblint Service | http://www.unipress.com/cgi-bin/WWWeblint |
You also can check the sites listed in Table 20.2 for a list of the most current HTML validation tools.
Table 20.2. Reference sites for HTML validation tools.
| Topic | Location |
| HTML Checkers | http://www.yahoo.com/Computers/World_Wide_Web/HTML/ Validation_Checkers/ |
| Validation Discussion | http://www.earth.com/bad-style/why-validate.html |
| Validation Tools | http://www.ccs.org/validate/ |
Component Errors
This category involves those errors that occur while using a component such as a Java applet, an ActiveX control, or an Active Server Component program. You will invariably incorporate these objects into your application. If you encounter a problem with one of these components, you need to use the software tool that was used to create the object to debug the error. For example, if you encounter a problem with a Visual Basic Active Server Component, you can use the robust debugger included with Visual Basic 5.0 to resolve the problem. If you don't locate the problem within the Visual Basic environment, the other option is to verify that you're setting the right properties and using the object correctly within your Visual InterDev project.
Database Errors
Database errors involve problems that you encounter while trying to access your database. These errors include SQL syntax errors, logic errors, connection problems, and access errors. To resolve database errors, you tackle them in the correct order. First, you need to make sure that you can connect to the database and that you can access the desired tables and information. Next, you need to make sure that your syntax is correct for SQL statements. Then, you need to test your logic to ensure that the SQL produces accurate results. The Visual data tools provided in Visual InterDev enable you to address all of these possible problem situations.
Script Errors
The use of scripting languages like VBScript and JavaScript is increasing due to the growing number of dynamic applications that are being created. This increase again augments the chance for errors in your Visual InterDev projects. The types of script errors that you can expect to find include syntax and logic errors. Syntax errors occur when you use the wrong syntax for a scripting language command. Logic errors consist of script that doesn't provide the intended result. The majority of the lesson focuses on how to resolve these errors.
Debugging Your Script
The increased use of scripting languages to create dynamic applications has increased the aspirin intake for Web application developers. The reason for the rising number of headaches among this group is that there haven't been many sophisticated script debugging tools to hit the market. Most developers have regressed to the old trial and error method due to the lack of these tools.
This section covers the types of errors that you can expect to encounter in your scripting logic. The lesson focuses on VBScript, but the concepts apply to other scripting languages such as JavaScript. After you know what you're facing, the lesson outlines some effective methods for tackling these problems.
Types of Errors
The types of errors that you can expect to face concerning your scripting code consist of two main categories--syntax and logic. An error in syntax means that you used a command in the wrong manner or that your code conflicts with the rules of the VBScript run-time interpreter. The following line of code contains a VBScript syntax error:
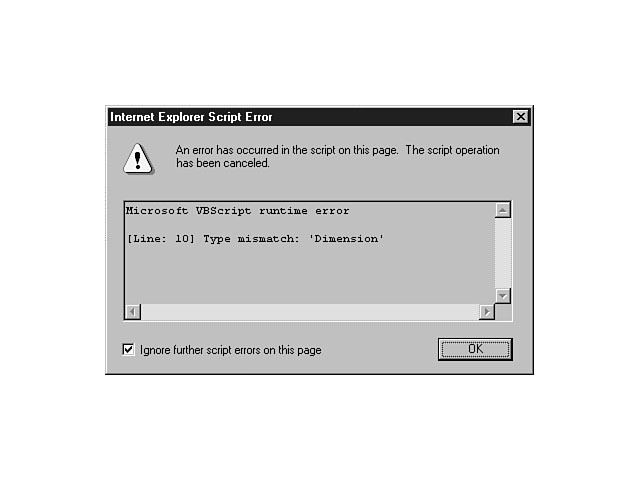
Dimension MyVariable
This statement results in an error because the correct VBScript command hasn't been used to define this variable. Figure 20.5 depicts the error that results from this erroneous statement.
Improper use of VBScript.
The correct syntax for this statement should be as follows:
Dim MyVariable
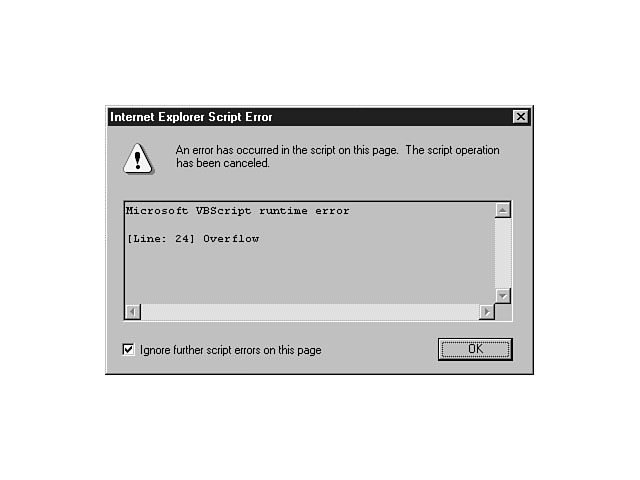
Other examples of syntax errors include errors where the rules of VBScript have been broken. For example, this statement results in a VBScript error:
Dim X, Y, Z
Y = 0
Z = X/Y
In this example, an error occurs as shown in Figure 20.6, because you cannot divide by zero.
Breaking the rules.
Syntax errors basically revolve around the question of validity. Is the statement valid according to the rules of VBScript?
The other category of scripting errors that you will face include logic errors. These errors involve the accuracy of your code. Is the statement reliable? Does the scripting code produce the desired results for your application? Your code can be completely valid according to the rules of VBScript but not address the needs of your application, thereby producing inaccurate results. These errors are harder to find, because the VBScript interpreter no longer provides you with any help. As far as it's concerned, the code looks great. You must decide if the logic accomplishes its intended purpose. An example of a logic error is depicted in the following lines of code:
Dim Discount, Price, SalePrice
Discount = .10
Price = 25
SalePrice = Price * Discount
This example attempts to calculate the sale price for an item. The discount for the item is 10 percent. In the code example the price is multiplied by the discount to determine the sale price. Can you identify what is wrong with this logic? If you multiply the price by the discount, you're actually calculating the discount amount to subtract from the price. When this logic is implemented, the customer receives a discount of 90 percent rather than the intended 10 percent. Your next question is, "Where do I find this store?" The line of code that calculates the sale price should actually be the following:
SalePrice = (Price - (Price * Discount))
The developer of this code was able to locate the error before the application was put into production, thereby saving his job. The method for discovering the error, however, involved a laborious process of trial and error. This programmer later learned some other methods for debugging scripting logic and is a much happier person today. Some of these methods are covered in the following sections.
Using Error Handling Routines
One option for debugging your VBScript code is to insert error-handling routines as a part of the code. VBScript includes several methods that enable you to trap errors within your script and deal with them in the proper manner. The following sections cover two of the more popular methods.
Resolving Errors with a Statement
The first methods involve the use of the VBScript On Error statement. This statement enables you to capture an error and enables the application to continue executing. Accomplished Visual Basic programmers may be familiar with using this method in their client-server applications. The basic syntax for the On Error statement is as follows:
On Error Resume Next

... Block of Code ...

On Error Resume Next
The On Error statement tells the VBScript interpreter to ignore the error and proceed on to the next statement as though nothing had happened. This scenario is analogous to a situation where you witness a person who has just been hit by a car. Your natural reaction is to go help the individual and call for an ambulance, but you are told to move along, because everything is fine. It's very hard to accept this statement, because everything is not fine.
With Visual Basic, you can both recognize the error as well as send the logic to an error-handling routine to determine the severity of the error and take the necessary actions. VBScript is limited in that you can only proceed to the next statement using this method. The next section demonstrates how to extend the effectiveness of the On Error statement to debug your code.
Resolving Errors with an Object
The On Error statement can be extended to properly handle your VBScript errors within your application by using the err object. This object is an inherent VBScript object and enables you to incorporate debugging and run-time logic into your application. Because the err object is an intrinsic object, it's freely available throughout your code without any extra effort on your part. All you need to do to use the object is to reference it after the On Error statement.
Table 20.3 explains the available properties of the err object. Table 20.3. Err object properties.
| Property | Description |
| Number | Numeric error code |
| Description | Description of the error code |
| Source | Name of the program that caused the error |
| Helpfile | Name of a help file with more information on the error |
| HelpContext | ID of the topic index for the help file |
You also can use two methods with the err object--Raise and Clear. The Raise method enables you to create an error within your application. Why, you ask, would you even consider creating an error in your application? This method can be used to test how your application responds to adversity. For instance, it's already been established that you don't produce bugs in your code. You, therefore, don't know how your application would respond to an error.
This situation is analogous to the basketball team that wins 20 games in a row. The coach of the team is concerned going into the playoffs, because the players haven't been tested with a trial. Now, don't get me wrong, there's nothing wrong with winning every game. Unfortunately, the undefeated season doesn't happen very often. Also, many times a team that wins several games in a row will, after a defeat, lose several games. They then have to adjust to the different feeling and take the necessary steps to get back on the winning track. Likewise, you can test your application using the Raise method to ensure that your application can handle adversity.
You use the Clear method to clear the contents of the err object. This method should only be used after an error has been detected and dealt with properly. The worst thing you can do is to clear out the err object before the application has processed the error. This situation results in disaster for your application, because it no longer knows the error it is processing or what to do next.
Listing 20.1 demonstrates an example of using the On Error statement with the err object to properly handle the bugs in your application.
Listing 20.1. Effective error handling.
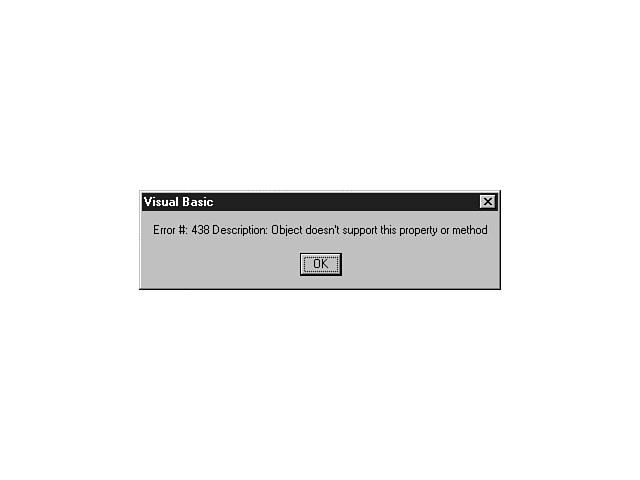
Sub cmdSubmit_OnClick ()
On Error Resume Next
Dim SalePrice

SalePrice = (txtRetailPrice.Text - (txtRetailPrice.Text*txtDiscount.Text))

If err.number <> 0 Then
MsgBox "Error #: " & err.number & " Description: " & err.description &
"Source: " & err.Source
End If

End Sub
This code calculates the sale price based on the retail price and discount that the user enters on the form. The err object is used to check for a number that isn't equal to zero, which indicates an error. If an error occurs, a message box is displayed to the user, as shown in Fig-ure 20.7.
Displaying an error.
Using the Microsoft Script Debugger
At the time of press for this book, Microsoft had just come out with a debugger for testing your script code. The Microsoft Script Debugger (MSD) provides a fairly robust tool for debugging both VBScript and JScript code. This debugger is intended to be used with Internet Explorer to provide an integrated environment with which to test your script code. The following list outlines the basic features of the script debugger:
- Ability to set breakpoints in the code
- Ability to sequentially step through the code
- Integrated view of JScript and VBScript call stack
- Ability to immediately evaluate the value of a variable or expression
- Color-coded syntax
- Ability to dynamically view HTML structure of the web page
- Ability to view the HTML object model for the page
NOTE: The Microsoft Script Debugger is included on the CD-ROM with this book.
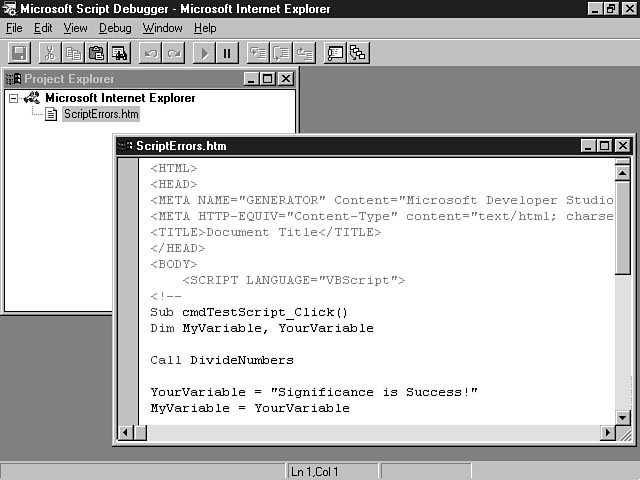
Once the script debugger is installed on your machine, you can open your web pages with Internet Explorer and choose Source from the View menu. The MSD environment is activated, displaying the code for the page in debug mode, as shown in Figure 20.8.
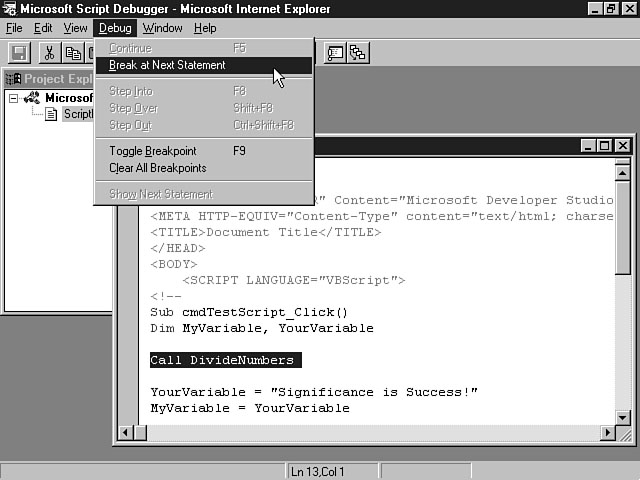
The MSD provides a Project Explorer that enables you to see all of the currently opened files and their contents. The Code window enables you to view and interact with the code for the page. This window enables you to set breakpoints and step through the code. You can set a breakpoint by placing your cursor on the desired line in the Code window and selecting the Debug menu, as shown in Figure 20.9.
The MSD environment.
Setting a breakpoint.
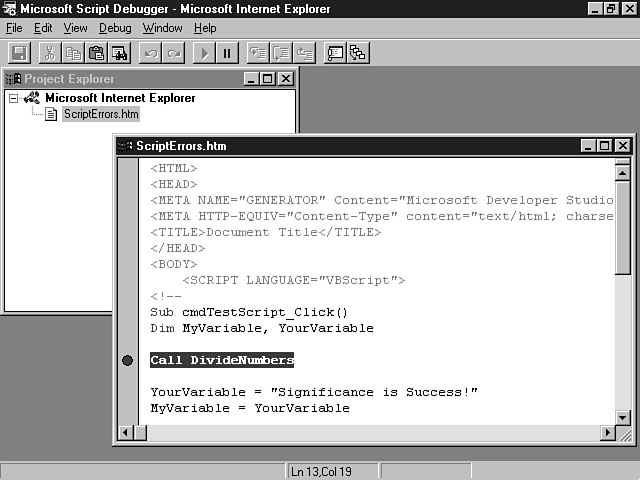
From this menu, you can set a breakpoint for a line of code by choosing the Break At Next Statement menu item. The line for which you have set the breakpoint will display in the Code window, as shown in Figure 20.10.
Viewing a breakpoint.
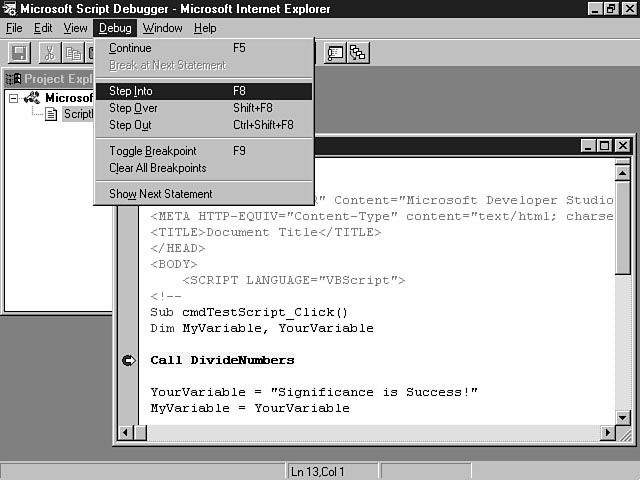
As you can see, the line of code appears highlighted in red. Also, a red circle is displayed to the left side of the code. When you view the page and execute the code, the debugger pauses at the breakpoint that you have set. You can then choose to continue executing the rest of the code. You also can choose to sequentially step into the line of code, step over the code, or step out of the code, as shown in Figure 20.11.
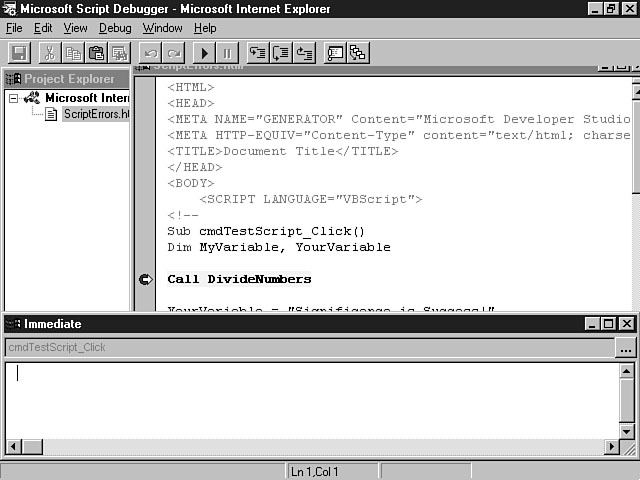
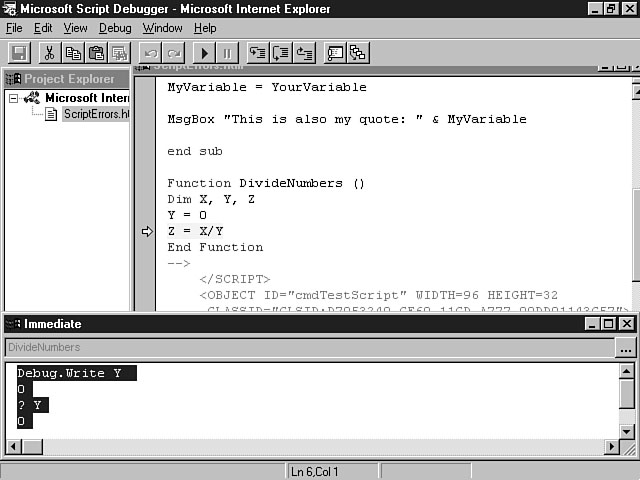
Besides enabling you to traverse through your code, the MSD enables you to view the value of your variables in the Immediate window. To display this window, select the View menu and choose Immediate window. The Immediate window is displayed as shown in Figure 20.12.
You can then type in a variable or expression name to evaluate. Figure 20.13 demonstrates two methods of displaying the values of a variable.
This example shows two methods for viewing the value of your variables. You can use the Debug.Write method along with its variable name to display its value, or you can use the ? (question mark) shortcut method.
Stepping through your code.
The Immediate window.
Viewing the value of a variable.
The MSD provides a significant enhancement for Internet Explorer that enables you to debug your script. The environment is very similar to the Visual Basic debugger and enables you to truly test and safeguard your code against unwanted bugs. The MSD also helps you verify the accuracy of your code by enabling you to check the values of your variables and expressions.
Common Considerations About Bugs
You might as well resolve yourself to the fact that bugs will appear in your code someday. As a Web developer, you realize the complexity of testing the various components of your Web-based application. There's no one silver bullet or surefire way to exterminate your bugs. You should use a combination of the tools and methods mentioned in this lesson to help you through this process.
You're probably not going to find an integrated debugging tool that tests your application from front to back; that is, from your HTML web page through your ActiveX controls and Java applets to your Active Server Pages and Components to your database. You need to break your application into its respective parts and test these components with the best tool or method possible. For example, use tools like Doctor HTML to evaluate your HTML. Then, test the integration of ActiveX controls and Java applets into your web pages. You can then use the tools and methods mentioned previously in today's lesson to test your scripting logic. Finally, you can use the native development environments like Visual Basic and Visual C++ for your more advanced components. You also can use the Visual data tools to test the database components of your application.
As far as integrated testing, you're the one who's going to have to pull it all together. With no integrated tool available, you will have to face this task alone. The best method for performing an integrated test of your application is to use the methods and processes that were discussed on Day 3, "Design and Development Considerations." Refer back to this lesson for a refresher on these tips and techniques regarding integration testing.
Summary
It will be very interesting to watch the emerging developments in the area of Web-based application testing. Right now, there aren't true integrated debuggers that can examine your total application. Tools like the Microsoft Script Debugger and Doctor HTML can help, but developers will be clamoring for more as the area of application development for the Web continues to grow. Just as client-server testing tools are maturing, Web-based testing tools will arrive to meet the needs of its constituents.
Today's lesson provided an overview regarding how to test your Web-based applications. First, the lesson outlined the types of bugs that you might encounter when you develop an application for the Web. You also learned about some of the tools that are available to help you exterminate these bugs. The next few lessons focused on debugging your script code, which leaves the most room for error in your application. You learned about some error handling statements and routines that you can use in your code to help take the bite out of the bugs in your application. You then discovered a new tool that has been introduced by Microsoft to help alleviate the pain of debugging script code. The lesson provided an introduction to the Microsoft Script Debugger, which enables you to step through your code and monitor its results. The final lesson for the day focused on some common considerations and concepts to ponder concerning the testing of your application.
As a Web developer, you should publicize your needs and requirements regarding testing tools to your neighborhood software vendor. Make your requests known, and they will be answered by the companies that want to remain in business.
Q&A
- Q How can I expect to deliver a quality, Web-based application when there
are no adequate testing tools?
A This is an excellent question with no magic answer. The tools that are emerging enable you to test different components of your application. If you think about client-server testing tools, they're still emerging and don't provide the silver bullet either. There are still times when you have to implement compartmentalized testing techniques to examine the effectiveness and accuracy of your client-server application.
The central problem is that while emerging technologies like the Web offer much more functionality than the olden days of mainframe applications, they add several extra layers of complexity. In other words, you have to pay for the added features just as you would for a new car. The best way to address the testing dilemma is to use the best tools for each type of technology contained in your application. Then, you should implement a robust testing plan for the integration of these components within your application. This plan will enable you to perform an effective, trial-and-error approach for the integration test of your application. Remember, there will always be some degree of manual testing, no matter what kind of application you are developing.
Q Can I use the methods that you have discussed in this lesson with Visual InterDev?
A Yes. All of the methods that have been covered can be used for testing your Visual InterDev application. While tools like Doctor HTML will be executed outside of the Visual InterDev environment, the Visual data tools and error handling routines can be employed within the confines of the project workspace. Also, the VBScript interpreter will run inside of the Visual InterDev environment when you preview the page with the internal browser, allowing you to receive instant feedback on the validity of your code.
Workshop
Today's workshop involves more research on the topic of Web-based testing and debugging tools. You should review the sites that have been mentioned in this lesson as well as do some searching of your own. The goal is to proactively find some methods and tools that will help you debug your application. Knowing the complexity of this task, you can be prepared by doing research up front and becoming knowledgeable about the right solutions for your needs.
Quiz
- 1. What are the four general categories that you will find in a Web-based
application?
2.What object can be used to determine the number and description for a VBScript error?
3.What new tool from Microsoft addresses the need for debugging your script code?
Quiz Answers
- 1. HTML errors
Component errors
Database errors
Script errors
2 Err object
3.Microsoft Script Debugger
![]()
![]()
![]()
![]()